Market Outlook
April 12, 2018
Market Cues
Domestic Indices
Chg (%)
(Pts)
(Close)
Indian markets are likely to open flat tracking global indices and SGX Nifty.
BSE Sensex
0.2
60
33,940
U.S. stocks moved back to the downside during the last trading session. The
Nifty
0.1
15
10,417
weakness on Wall Street came amid geopolitical concerns after President Donald
Mid Cap
(0.2)
(32)
16,622
Trump warned Russia "get ready" for missiles being launched at Syria. The Dow
Small Cap
0.2
36
17,983
Jones ended down by 0.9% to close at 24,189. The NASDAQ ended down by 0.4%
to close at 7,069.
Bankex
(0.7)
(195)
28,173
U.K. stocks were marginally lower, with concerns over rising tensions in Syria and
Global Indices
Chg (%)
(Pts)
(Close)
weak industrial output data weighing on markets. The FTSE 100 was down by 1.0%
to end at 7,257.
Dow Jones
(0.9)
(219)
24,189
Nasdaq
(0.4)
(25)
7,069
On domestic front, Indian shares eked out modest gains despite rising oil prices and
FTSE
(0.1)
(10)
7,257
mounting tensions in the Middle East. With trade-war worries easing somewhat,
traders looked ahead to Infosys' earnings and macroeconomic readings on
Nikkei
(0.1)
(13)
21,675
industrial output and retail inflation due on Thursday for direction. The BSE Sensex
Hang Seng
0.2
67
30,964
ended up by 0.2% at 33,940.
Shanghai Com
(0.4)
(12)
3,197
News Analysis
Advances / Declines
BSE
NSE
Tata Sons to merge aerospace and defence business under one entity
Advances
1,198
732
Detailed analysis on Pg2
Declines
1,520
1,058
Investor’s Ready Reckoner
Unchanged
132
65
Key Domestic & Global Indicators
Volumes (` Cr)
Stock Watch: Latest investment recommendations on 150+ stocks
Refer Pg5 onwards
BSE
3,133
NSE
29,668
Top Picks
CMP
Target
Upside
Company
Sector
Rating
(`)
(`)
(%)
Net Inflows (` Cr)
Net
Mtd
Ytd
Blue Star
Capital Goods Accumulate
795
867
9.1
FII
(717)
(1,740)
11,867
Dewan Housing Finance
Financials
Buy
531
720
35.6
*MFs
15
3,398
37,857
Century Plyboards
Forest Product Accumulate
351
400
13.9
Navkar Corporation
Others
Buy
175
265
51.4
KEI Industries
Capital Goods Accumulate
454
485
6.9
Top Gainers
Price (`)
Chg (%)
More Top Picks on Pg4
IRB
280
10.0
Key Upcoming Events
SPARC
429
8.5
Previous
Consensus
Date
Region
Event Description
SUPREMEIND
1,299
7.5
ReadingExpectations
Apr 12, 2018 China
Consumer Price Index (YoY)
2.10
2.60
TATASPONGE
1,081
5.0
Apr 12, 2018 India
Industrial Production YoY
7.50
6.80
KWALITY
60
4.9
Apr 13, 2018 China
Exports YoY%
44.50
11.80
Apr 13, 2018 India
Imports YoY%
10.41
Top Losers
Price (`)
Chg (%)
Apr 13, 2018 India
Exports YoY%
4.48
More Events on Pg7
HINDPETRO
337
-7.6
BPCL
418
-7.4
IOC
168
-6.4
VAKRANGEE
147
-5.0
CHENNPETRO
334
-4.7
As on April 11, 2018
Market Outlook
April 12, 2018
News Analysis
Tata Sons to merge aerospace and defence business under one entity
Tata Sons is in the process of consolidating its various businesses
across aerospace and defence sectors under a single entity Tata Aerospace &
Defence (Tata A&D). Tata A&D proposes to bring together over 6,000 employees,
and have production facilities in Telangana, Karnataka, Jharkhand, and
Maharashtra, it added. Subsequent to the consolidation, Tata A&D will draw
synergies from entities across the group, including Tata Motors' defence
division, TAL
Manufacturing
Solutions
Limited (subsidiary
of Tata Motors), Tata Power's strategic engineering division, Tata Advanced
Materials Limited, and Tata Advanced Systems Limited. The company said that the
combined entity will also be deeply invested in the development of indigenous
platforms uniquely suited for the Indian defence forces, which is central to new
entity's long-term strategy.
Economic and Political News
Indian economy to grow 7.3% this fiscal, fastest across Asia
Retail inflation expected to be five-month low as food prices drop
Oil PSUs say no directive from government to defer petrol, diesel price hike
Corporate News
Tata Sons to merge aerospace and defence business under one entity
Bajaj Electricals wins Rs 23.8-bn order from Purvanchal Vidyut Vitran Nigam
Adani, Punj Lloyd and Rave tie up for producing defence and aerospace
gears
Cyient and BlueBird Aero Systems form joint venture to offer UAV Systems
Adani Group may now look at projects under toll-operate-transfer model
Market Outlook
April 12, 2018
Quarterly Bloomberg Brokers Consensus Estimate
RBL Ltd. - April 13, 2018
Particulars ( ` cr)
3QFY18E
3QFY17
y-o-y (%)
2QFY18
q-o-q (%)
PAT
170
130
30.7
165
2.9
Infosys Ltd - April 13, 2018
Particulars ( ` cr)
3QFY18E
3QFY17
y-o-y (%)
2QFY18
q-o-q (%)
Sales
18116
17120
5.8
17794
1.8
EBIDTA
4874
4633
5.2
4817
1.2
%
26.9
27.1
27.1
PAT
3698
3603
2.6
5129
(27.9)
Market Outlook
April 12, 2018
Top Picks
Market Cap
CMP
Target
Upside
Company
Rationale
(` Cr)
(`)
(`)
(%)
Strong growth in domestic business due to its
leadership in acute therapeutic segment. Alkem
Alkem Laboratories
21,174
1,771
2,441
37.8
expects to launch more products in USA, which
bodes for its international business.
Favorable outlook for the AC industry to augur well
for Cooling products business which is out pacing
Blue Star
7,632
795
867
9.1
the market growth. EMPPAC division's profitability
to improve once operating environment turns
around.
With a focus on the low and medium income (LMI)
consumer segment, the company has increased its
Dewan Housing Finance
16,655
531
720
35.6
presence in tier-II & III cities where the growth
opportunity is immense.
Well capitalized with CAR of 18.1% which gives
sufficient room to grow asset base. Faster resolution
ICICI Bank
182,616
284
416
46.4
of NPA would reduce provision cost, which would
help to report better ROE.
High order book execution in EPC segment, rising
KEI Industries
3,557
454
485
6.9
B2C sales and higher exports to boost the revenues
and profitability
Expected to benefit from the lower capex
Music Broadcast Limited
2,207
387
475
22.8
requirement and 15 year long radio broadcast
licensing.
Massive capacity expansion along with rail
Navkar Corporation
2,635
175
265
51.4
advantage at ICD as well CFS augur well for the
company
Strong brands and distribution network would boost
Siyaram Silk Mills
3,392
724
851
17.6
growth going ahead. Stock currently trades at an
inexpensive valuation.
Market leadership in Hindi news genre and no. 2
viewership ranking in English news genre, exit from
TV Today Network
2,852
478
603
26.1
the radio business, and anticipated growth in ad
spends by corporate to benefit the stock.
After GST, the company is expected to see higher
volumes along with improving product mix. The
Maruti
280,867
9,298
10,619
14.2
Gujarat plant will also enable higher operating
leverage which will be margin accretive.
We expect loan book to grow at 24.3% over next
GIC Housing
2,137
397
655
65.1
two year; change in borrowing mix will help in NIM
improvement
We expect CPIL to report net Revenue/PAT CAGR of
~17%/16% over FY2017-20E mainly due to
Century Plyboards
7,800
351
400
13.9
healthy growth in plywood & lamination business,
forayed into MDF & Particle boards on back of
strong brand & distribution network.
We expect sales/PAT to grow at 13.5%/20% over
LT Foods
3,045
95
128
34.5
next two years on the back of strong distribution
network & addition of new products in portfolio.
Third largest brand play in luggage segment
Increased product offerings and improving
Safari Industries
1,396
627
670
6.8
distribution network is leading to strong growth in
business. Likely to post robust growth for next 3-4
years
We expect HSIL to report PAT CAGR of ~15% over
FY2017-20E owing to better improvement in
HSIL Ltd
2,915
403
510
26.5
operating margin due price hike in container glass
segment, turnaround in consumer business.
We expect financialisation of savings and
Aditya Birla Capital
35470
161
230
42.3
increasing penetration in Insurance & Mutual fund
would ensure steady growth.
Source: Company, Angel Research
Market Outlook
April 12, 2018
Fundamental Call
Market Cap
CMP
Target
Upside
Company
Rationale
(` Cr)
(`)
(`)
(%)
CCL is likely to maintain the strong growth trajectory
CCL Products
3,838
289
360
24.8
over FY18-20 backed by capacity expansion and new
geographical foray
We forecast Nilkamal to report top-line CAGR of ~9%
to `2,635cr over FY17-20E on the back of healthy
Nilkamal
2,569
1,721
2,178
26.5
demand growth in plastic division. On the bottom-line
front, we estimate ~10% CAGR to `162cr owing to
improvement in volumes.
The prism has diversified exposure in the different
segment such as Cement, Tile & ready mix concrete.
Prism Cement
5,882
117
160
36.9
Thus we believe, PCL is in the right place to capture
ongoing government spending on affordable housing
and infrastructure projects.
Elantas Beck India is the Indian market leader in liquid
insulation segment used in electrical equipments like
Elantas Beck India Ltd
1,745
2,201
2,500
13.6
motors, transformers etc. It derives demand from
several industries which are expected to register 10%+
CAGR in demand in the coming years.
Greenply Industries Ltd (GIL) manufactures plywood &
allied products and medium density fibreboards
(MDF). GIL to report net revenue CAGR of ~14% to
Greenply Industries
3,949
322
395
22.7
~`2,478cr over FY2017-20E mainly due to healthy
growth in plywood & lamination business on the back
of strong brand and distribution network
Ashok Leyland Ltd (ALL) is the flagship company of the
Hinduja Group, and one of the largest commercial
vehicle manufacturers in India. Ashok Leyland
Ashok Leyland
42,399
145
163
12.5
expected to report net Profit (reported) CAGR of ~19%
to
~`2,075cr over FY2017-20E mainly due to
improvement in replacement demand.
Source: Company, Angel Research
Market Outlook
April 12, 2018
Key Upcoming Events
Global economic events release calendar
Bloomberg Data
Date
Time Country
Event Description
Unit
Period
Last Reported
Estimated
Apr 12, 2018
7:00 AMChina
Consumer Price Index (YoY)
% Change
Mar
2.10
2.60
5:30 PMIndia
Industrial Production YoY
% Change
Feb
7.50
6.80
Apr 13, 2018
China
Exports YoY%
% Change
Mar
44.50
11.80
India
Imports YoY%
% Change
Mar
10.41
India
Exports YoY%
% Change
Mar
4.48
Apr 16, 2018
12:00 PMIndia
Monthly Wholesale Prices YoY%
% Change
Mar
2.48
2.51
Apr 17, 2018
2:00 PMUK
Jobless claims change
% Change
Mar
9.20
6:45 PMUS
Industrial Production
%
Mar
0.95
0.30
6:00 PMUS
Housing Starts
Thousands
Mar
1,236.00
1,260.00
6:00 PMUS
Building permits
Thousands
Mar
1,321.00
1,325.00
7:30 AMChina
Industrial Production (YoY)
% Change
Mar
6.20
6.40
7:30 AMChina
Real GDP (YoY)
% Change
1Q
6.80
6.80
Apr 18, 2018
2:00 PMUK
CPI (YoY)
% Change
Mar
2.70
2:30 PMEuro Zone
Euro-Zone CPI (YoY)
%
Mar F
1.40
Apr 20, 2018
1:00 PMGermany
PMI Services
Value
Apr P
53.90
Apr 23, 2018
7:30 PMEuro Zone
Euro-Zone Consumer Confidence
Value
Apr A
0.10
1:00 PMGermany
PMI Manufacturing
Value
Apr P
58.20
7:30 PMUS
Existing home sales
Million
Mar
5.54
Apr 24, 2018
7:30 PMUS
Consumer Confidence
S.A./ 1985=100
Apr
127.70
7:30 PMUS
New home sales
Thousands
Mar
618.00
Apr 26, 2018
5:15 PMEuro Zone
ECB announces interest rates
%
Apr 26
-
Apr 27, 2018
6:00 PMUS
GDP Qoq (Annualised)
% Change
1Q A
2.90
1:25 PMGermany
Unemployment change (000's)
Thousands
Apr
(19.00)
2:00 PMUK
GDP (YoY)
% Change
1Q A
1.40
Source: Bloomberg, Angel Research
Market Outlook
April 12, 2018
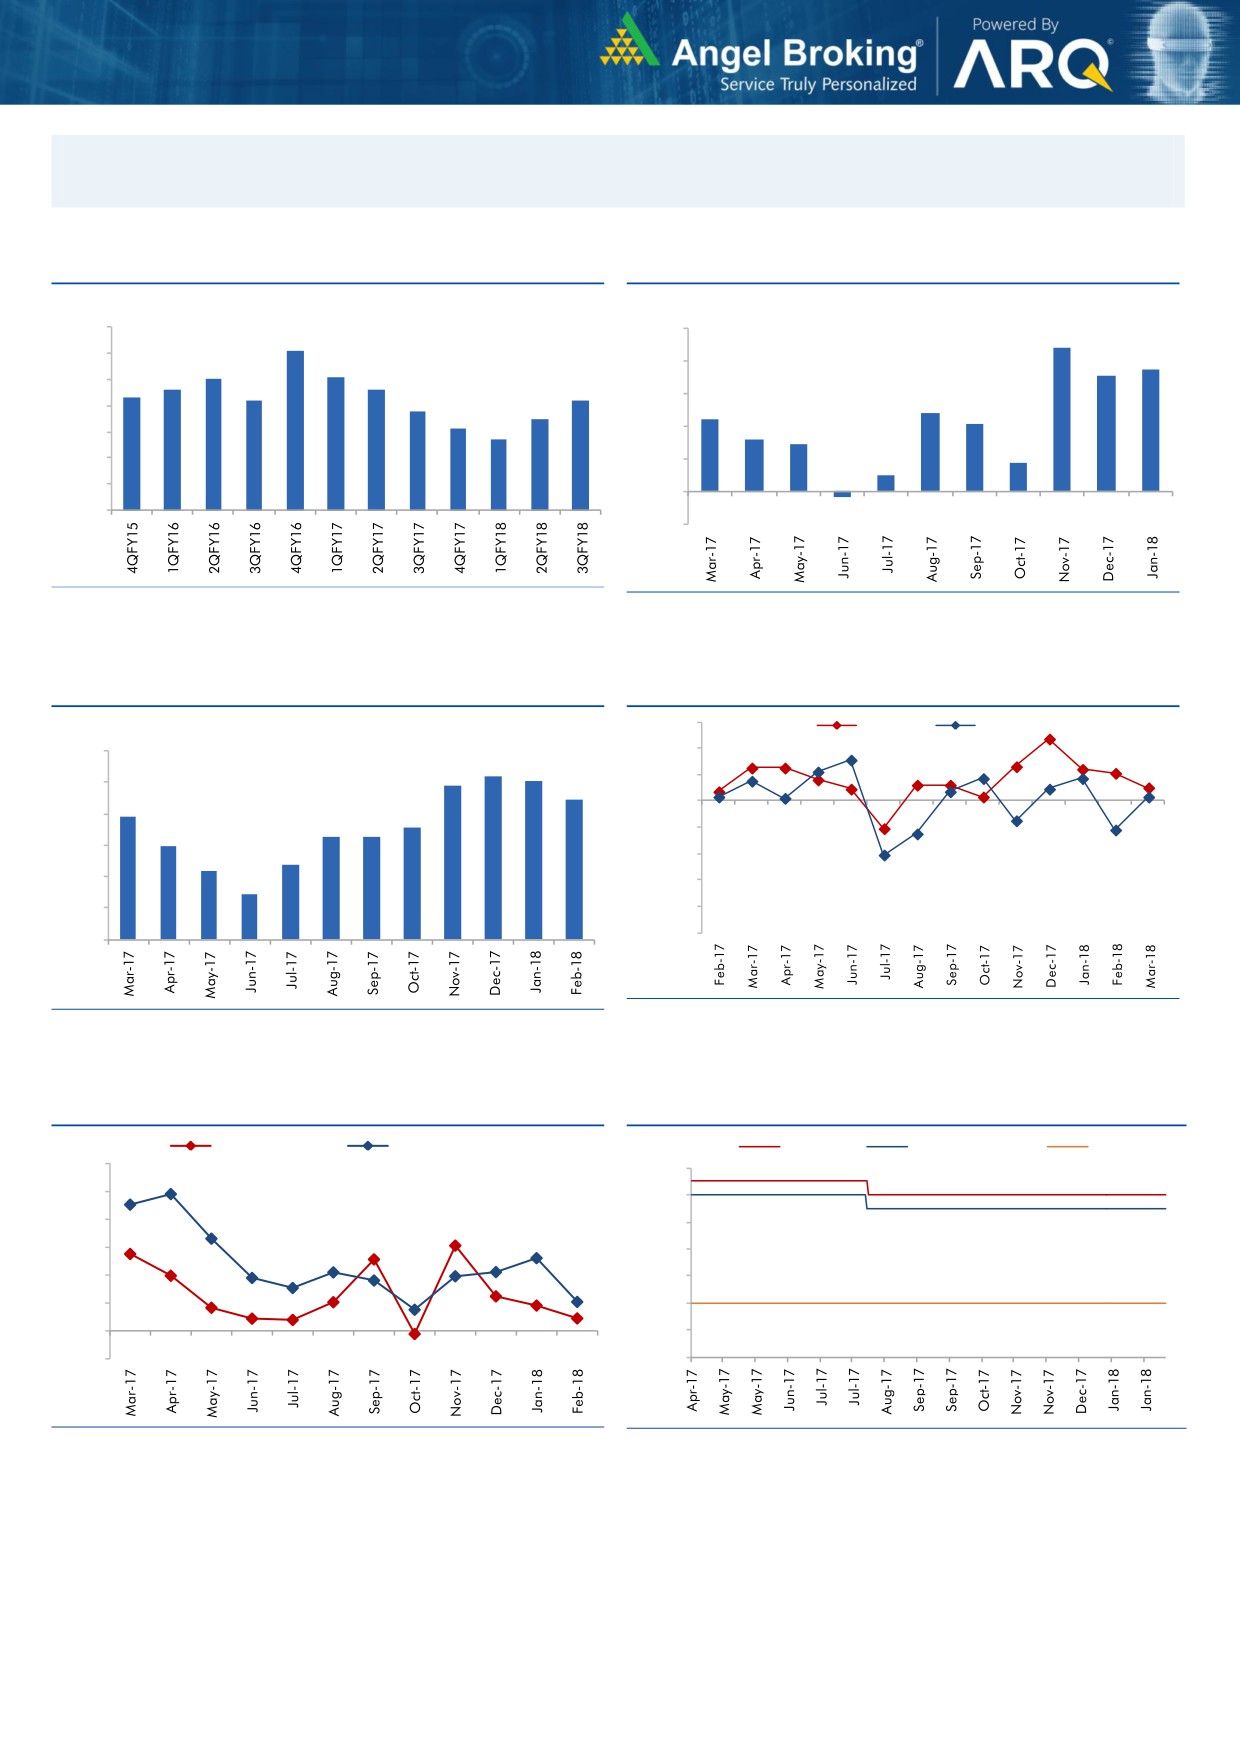
Macro watch
Exhibit 1: Quarterly GDP trends
Exhibit 2: IIP trends
(%)
(%)
10.0
10.0
9.1
8.8
9.0
7.5
8.0
8.1
8.0
7.1
7.6
7.6
8.0
7.3
7.2
7.2
6.8
6.0
4.8
7.0
6.5
4.4
6.1
4.1
5.7
4.0
3.2
2.9
6.0
1.8
5.0
2.0
1.0
4.0
-
3.0
(0.3)
(2.0)
Source: CSO, Angel Research
Source: MOSPI, Angel Research
Exhibit 3: Monthly CPI inflation trends
Exhibit 4: Manufacturing and services PMI
56.0
Mfg. PMI
Services PMI
(%)
6.0
54.0
5.2
5.1
4.9
52.0
5.0
4.4
3.9
50.0
4.0
3.6
3.3
3.3
3.0
48.0
3.0
2.4
2.2
46.0
2.0
1.5
44.0
1.0
42.0
40.0
-
Source: Market, Angel Research; Note: Level above 50 indicates expansion
Source: MOSPI, Angel Research
Exhibit 5: Exports and imports growth trends
Exhibit 6: Key policy rates
(%)
Exports yoy growth
Imports yoy growth
(%)
Repo rate
Reverse Repo rate
CRR
60.0
6.50
50.0
6.00
40.0
5.50
30.0
5.00
20.0
4.50
10.0
4.00
0.0
3.50
(10.0)
3.00
Source: Bloomberg, Angel Research
Source: RBI, Angel Research
Market Outlook
April 12, 2018
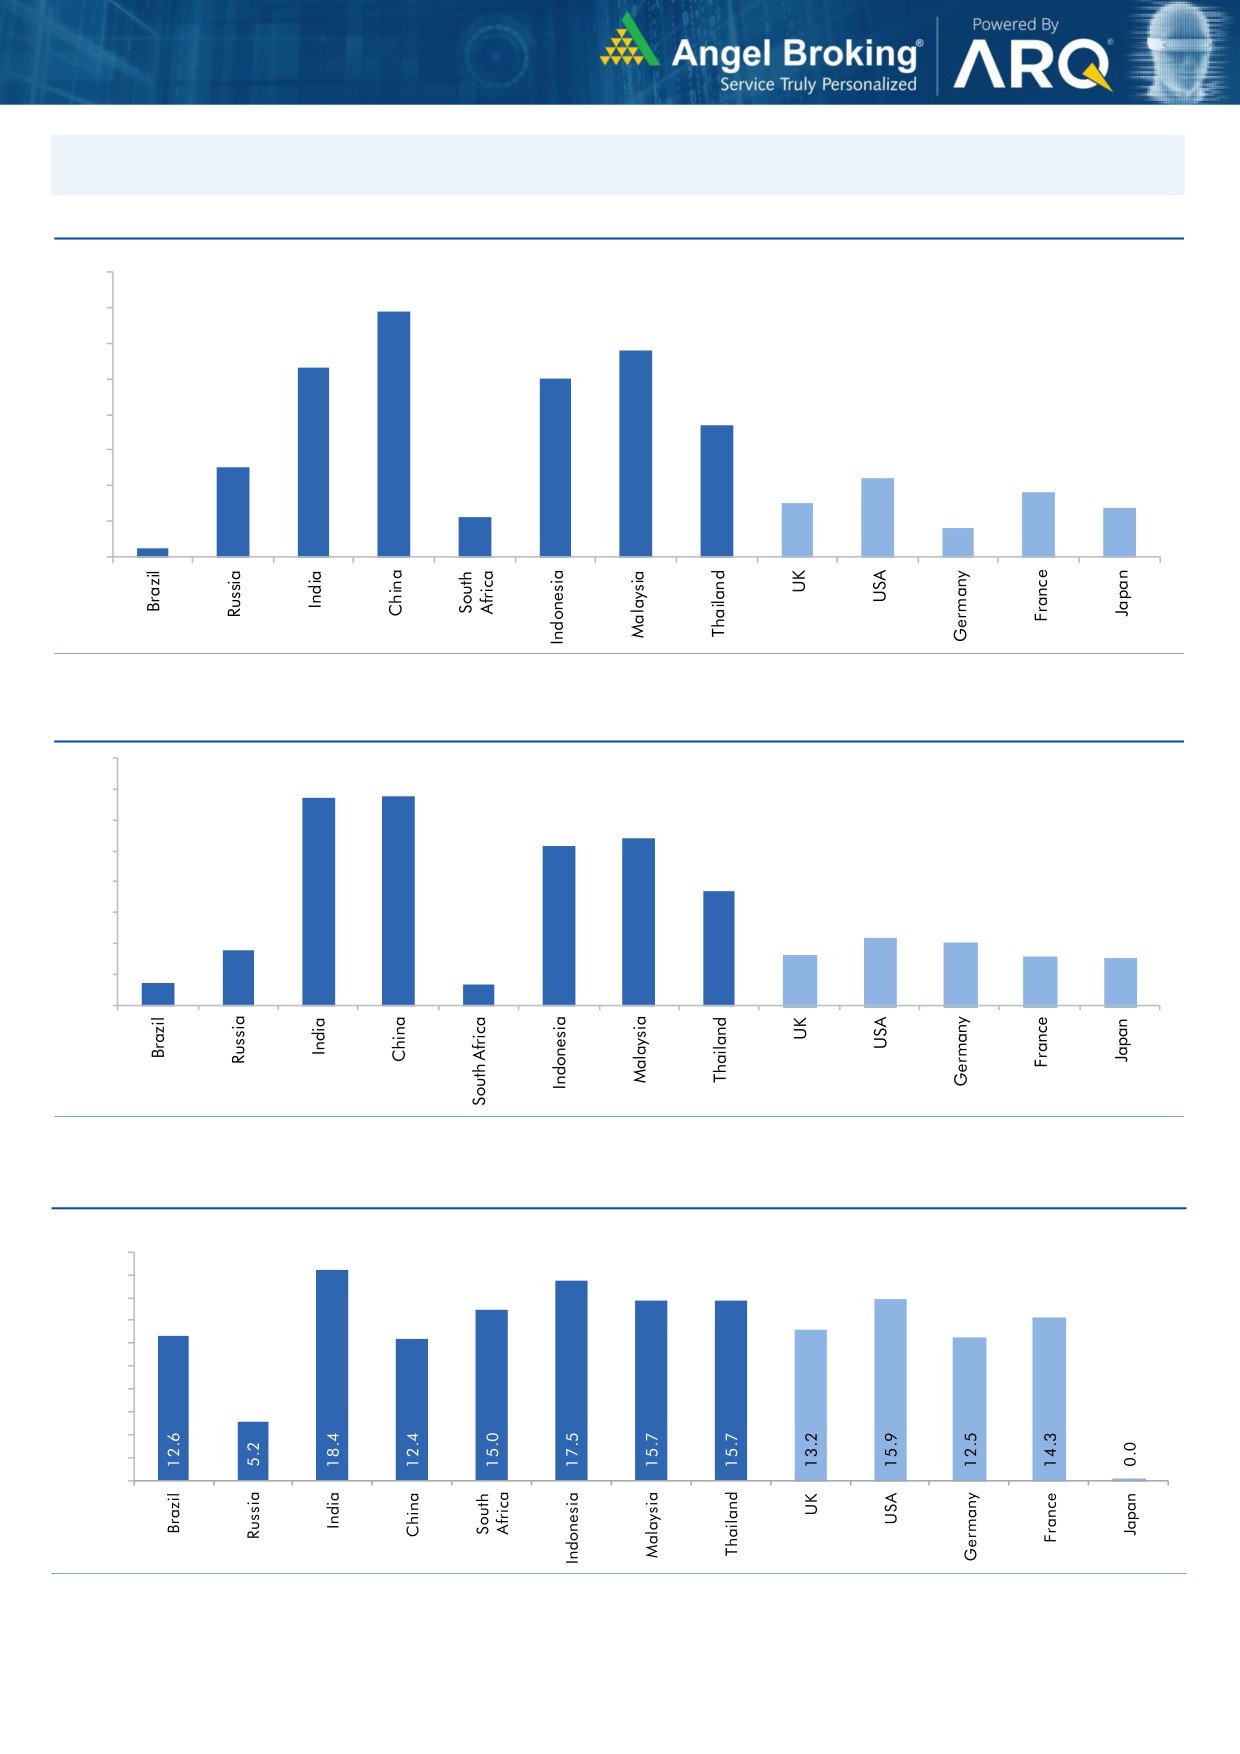
Global watch
Exhibit 1: Latest quarterly GDP Growth (%, yoy) across select developing and developed countries
(%)
8.0
6.9
7.0
5.8
6.0
5.3
5.0
5.0
1.1
3.7
4.0
2.5
3.0
2.2
1.8
2.0
1.5
1.4
0.8
1.0
0.3
-
Source: Bloomberg, Angel Research
Exhibit 2: 2017 GDP Growth projection by IMF (%, yoy) across select developing and developed countries
(%)
6.7
6.8
7.0
6.0
5.4
5.2
5.0
3.7
4.0
3.0
1.8
2.2
2.0
1.7
1.6
2.0
0.7
1.5
0.7
1.0
-
Source: IMF, Angel Research
Exhibit 3: One year forward P-E ratio across select developing and developed countries
(x)
20.0
18.0
16.0
14.0
12.0
10.0
8.0
6.0
4.0
2.0
-
Source: IMF, Angel Research
Market Outlook
April 12, 2018
Exhibit 4: Relative performance of indices across globe
Returns (%)
Country
Name of index
Closing price
1M
3M
1YR
Brazil
Bovespa
85,246
(1.3)
7.8
30.7
Russia
Micex
4,211
1.4
7.1
11.4
India
Nifty
10,417
1.7
(0.8)
12.5
China
Shanghai Composite
3,208
(3.2)
(5.0)
(0.7)
South Africa
Top 40
49,473
(4.9)
(6.9)
7.2
Mexico
Mexbol
48,532
1.8
(2.7)
(1.6)
Indonesia
LQ45
1,047
(3.6)
(4.2)
11.9
Malaysia
KLCI
1,870
0.5
2.1
7.1
Thailand
SET 50
1,164
(0.7)
(0.2)
16.8
USA
Dow Jones
24,189
(4.5)
(4.3)
17.1
UK
FTSE
7,257
0.7
(6.1)
(1.5)
Japan
Nikkei
21,687
1.0
(9.1)
15.3
Germany
DAX
12,294
(0.5)
(8.2)
0.8
France
CAC
5,278
0.5
(4.5)
4.1
Source: Bloomberg, Angel Research p68in4